IRA Portfolio vs. S&P 500
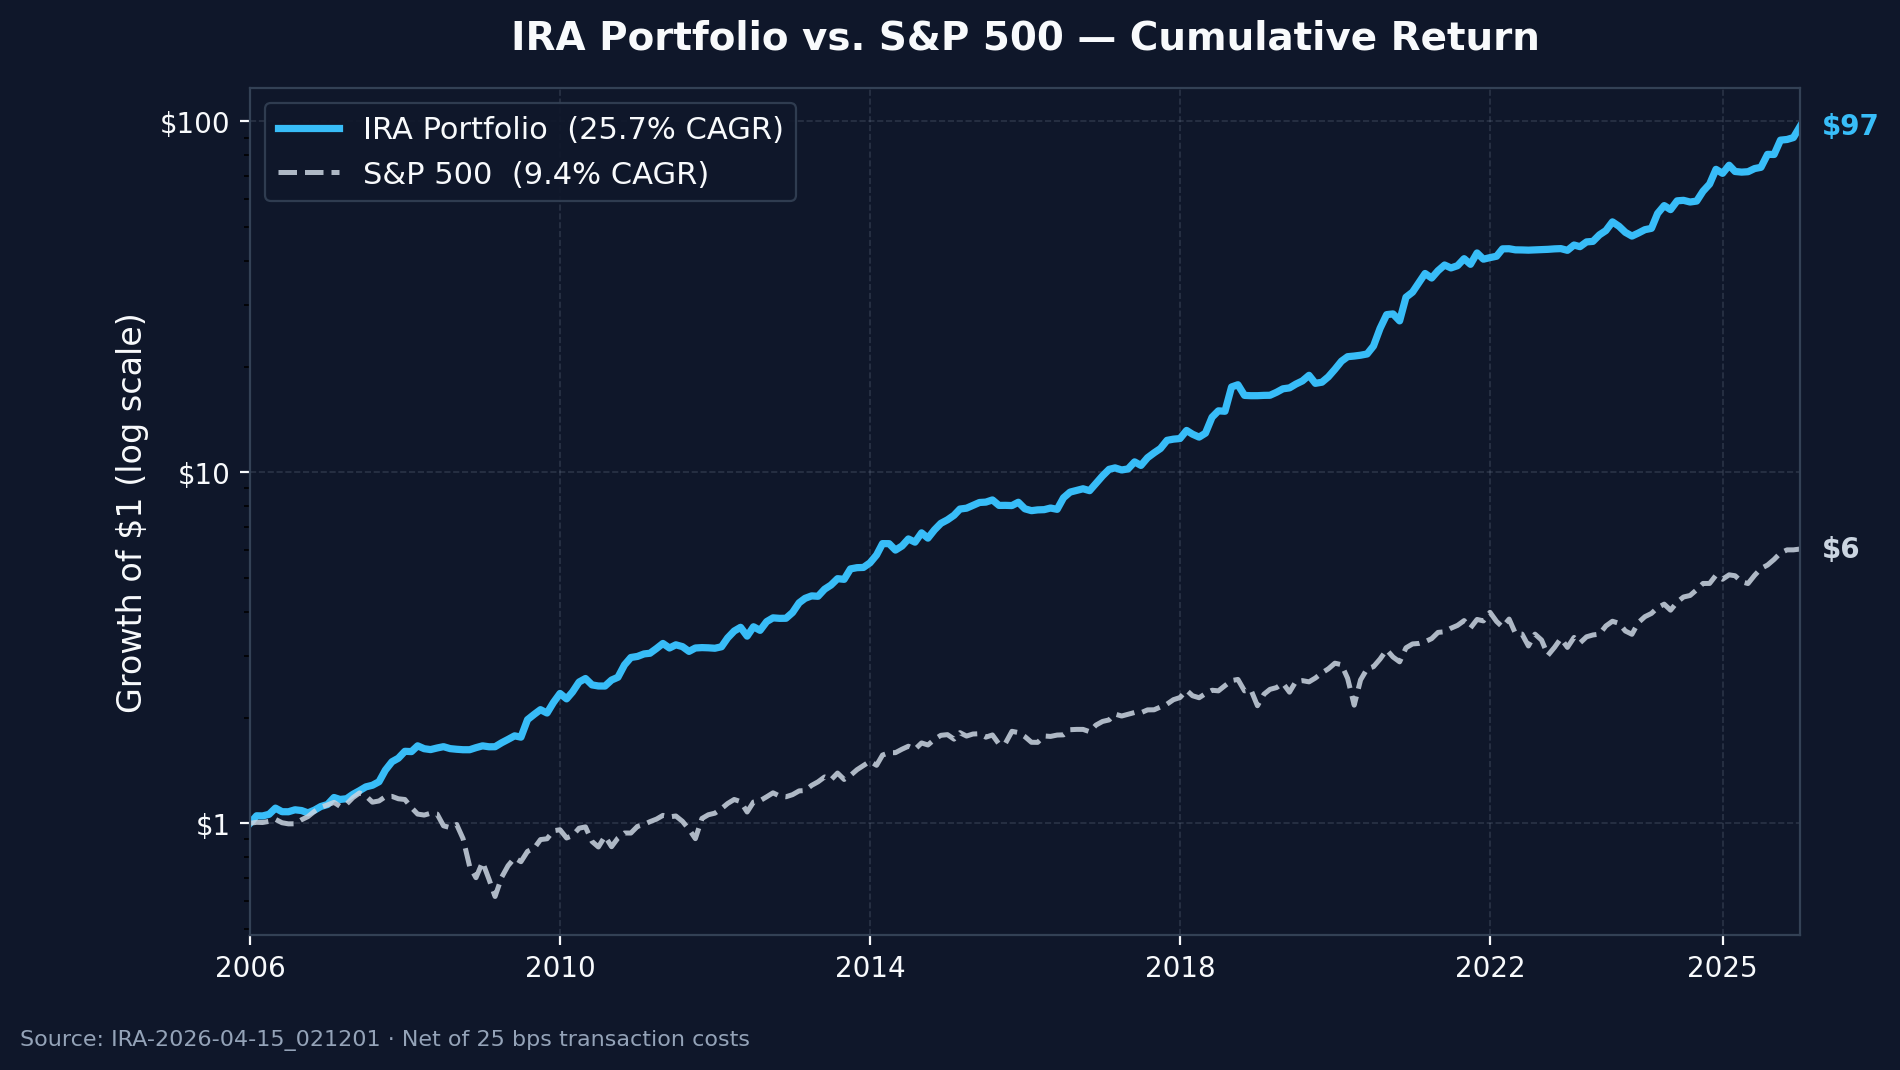
Growth of $1, January 2006 – December 2025 (log scale). Net of estimated transaction costs (25 bps).
A systematic momentum strategy with 20 years of backtested results and built-in risk controls.
Growth of $1, January 2006 – December 2025 (log scale). Net of estimated transaction costs (25 bps).
Each month, every investment in the universe is scored based on how it has performed over the past 3, 6, and 12 months. The top-ranked names are held; the rest are passed over. Things that are working tend to keep working.
Two layers of protection. If an individual holding falls below its own trend line, it's replaced with cash or the next-best alternative. If the broad market turns negative, the entire portfolio can rotate to cash — regardless of how individual holdings look. This is what kept all portfolios out of the 2008 and 2020 crashes.
The system reads Federal Reserve data — real Treasury yield, breakeven inflation, and the yield curve — plus the S&P 500’s 200-day trend, to classify the current economic environment as Inflationary, Goldilocks, or Restrictive. Sleeve weights shift automatically: tilting toward commodities in inflationary periods, stocks in goldilocks, and bonds when rates are restrictive. When the macro is restrictive but the broad market is trending up (SPY > 5% above its 200-day average), the classifier releases to goldilocks — catching the “false-alarm” yield curve inversions of 2023 and 2025 without compromising 2008-style protection (the trend signal cannot fire during a real bear market).
The primary retirement account strategy. Invests across five asset classes: US stocks, international stocks (a clean 25-ETF global universe), bonds, commodities, and a small options position. US stocks, bonds, and commodities rebalance monthly; international rebalances every other month.
| Avg Annual Return (CAGR) | 20.3% |
| Sharpe Ratio | 1.44 |
| Worst Drawdown | −7.9% |
| Negative Years | 1 of 20 (2011: −0.2%) |
A regular brokerage account strategy built for tax efficiency. Rebalances every other month to avoid wash-sale rule complications. Includes international stocks to qualify for the foreign tax credit. Same core approach as the IRA, tuned for after-tax performance.
| Avg Annual Return (CAGR) | 20.1% |
| Sharpe Ratio | 1.49 |
| Worst Drawdown | −8.3% |
| Negative Years | 1 of 20 (2008: −4.3%) |
Built specifically for Thrift Savings Plan accounts. Works within the limited TSP fund menu — no outside ETFs or stocks — to deliver systematic momentum returns. Relevant to the 6+ million federal employees and retirees with TSP accounts.
| Avg Annual Return (CAGR) | 15.0% |
| Sharpe Ratio | 1.21 |
| Worst Drawdown | −10.1% |
| vs S&P 500 Worst Drawdown | −49.3% |